Visualization of complex data
Visualize invisible to the eye data in virtual reality
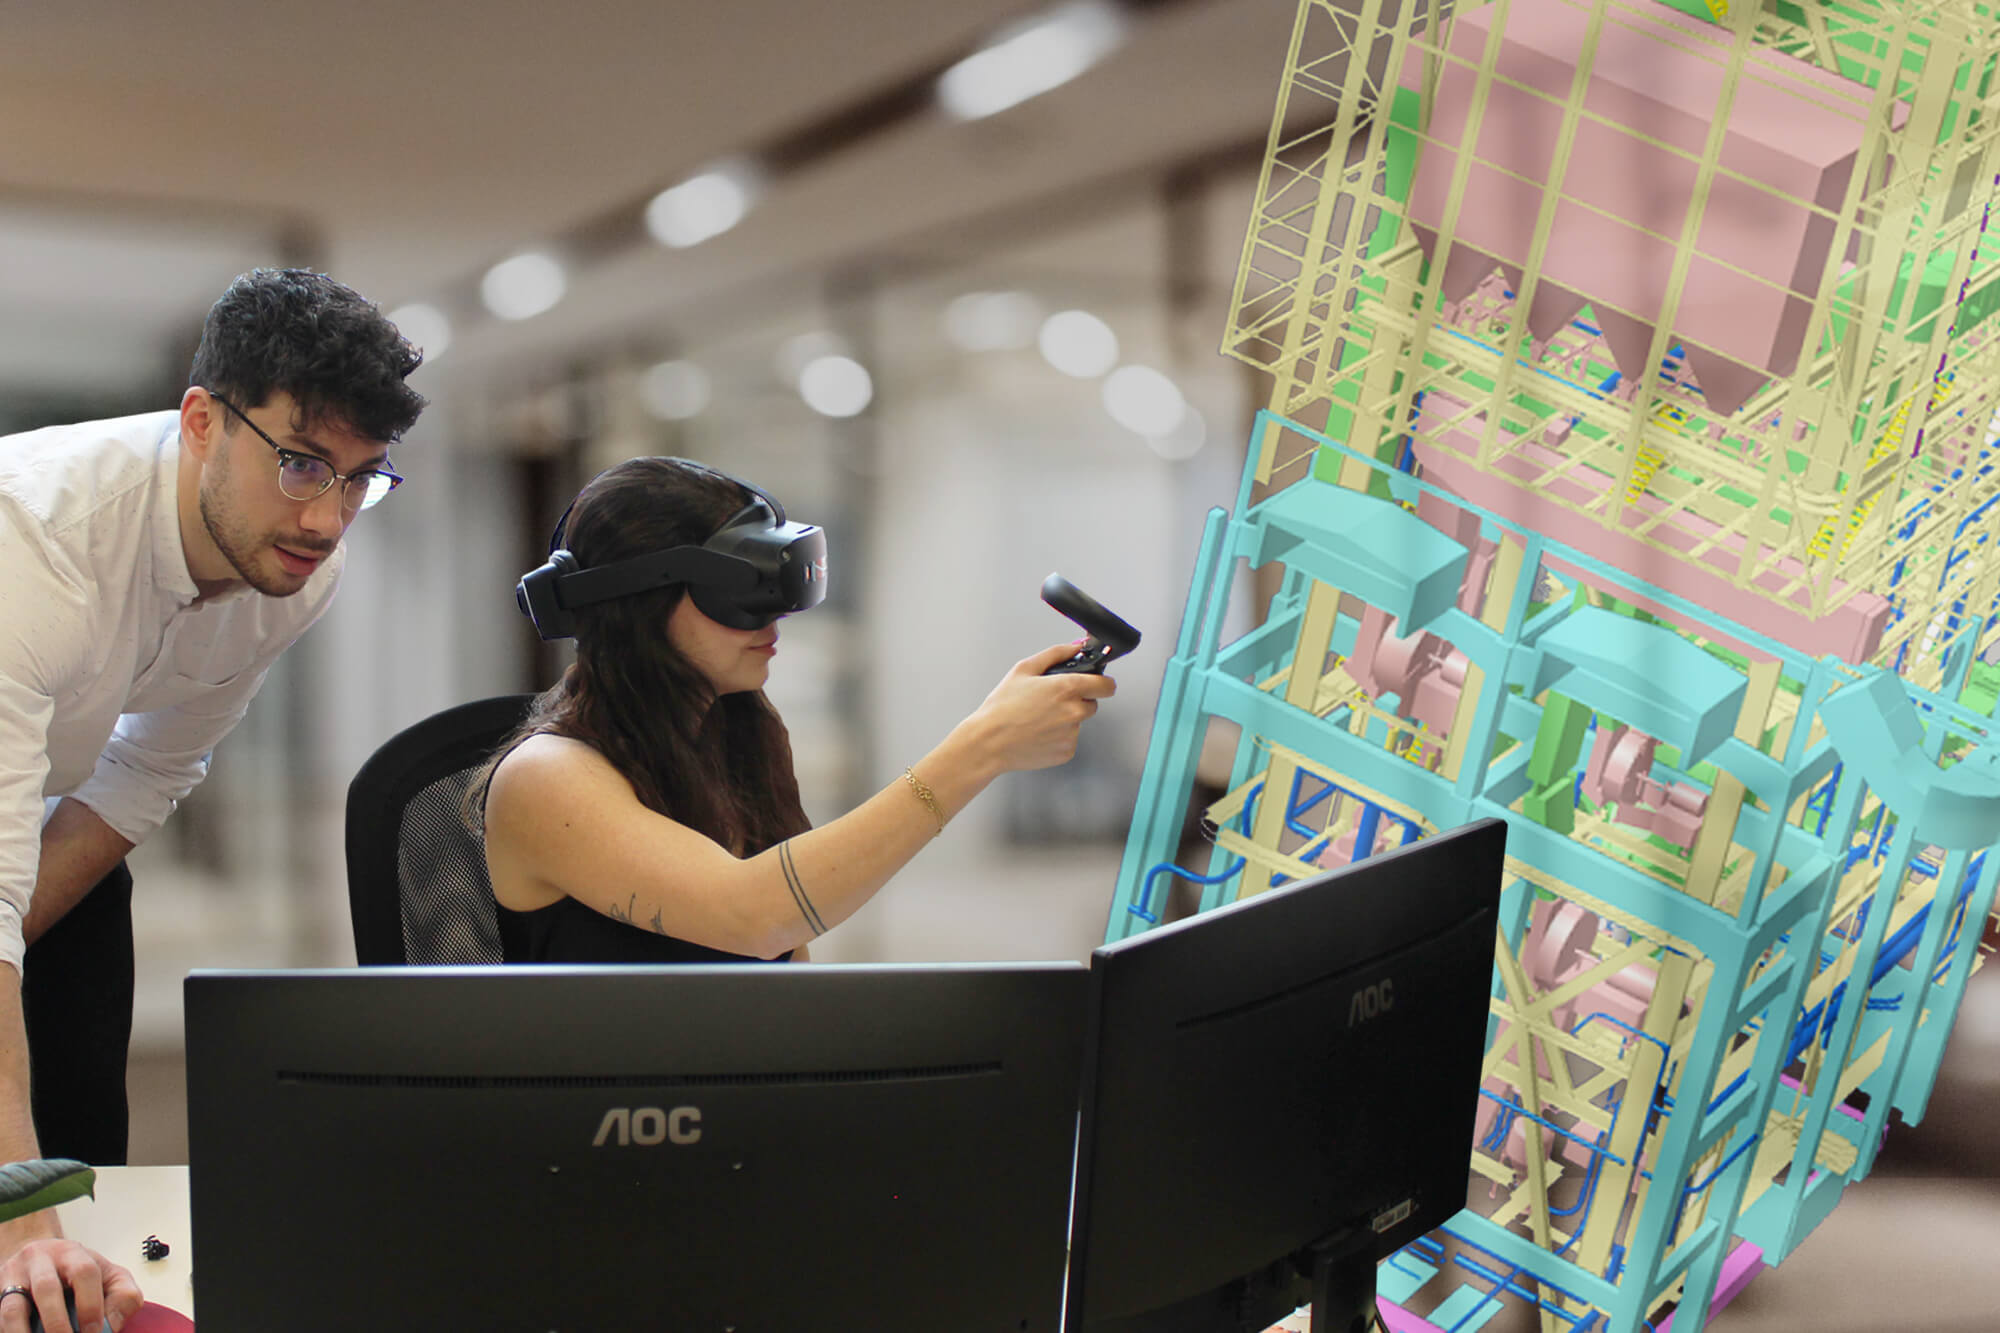
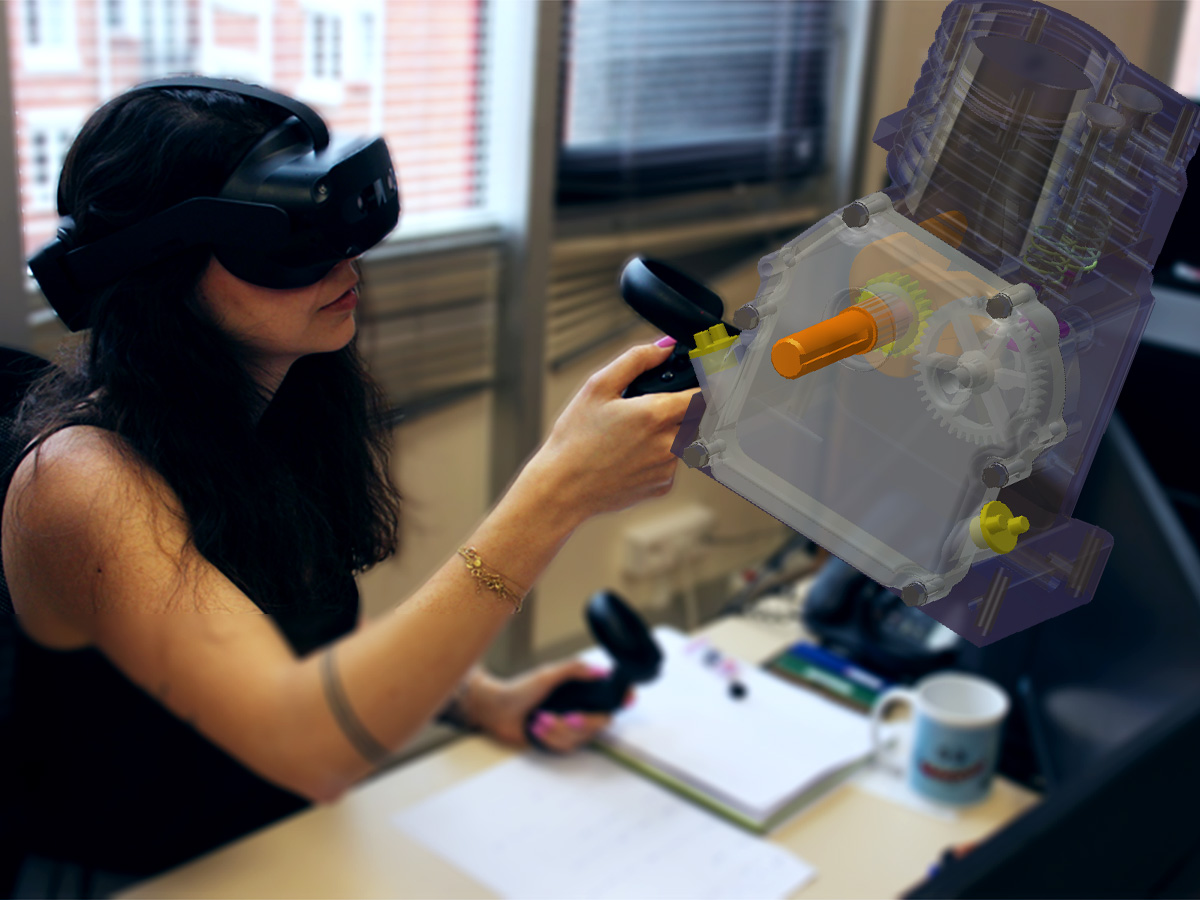
Sometimes, flat rendering is not enough to understand – or explain – complex sets of data. Being completely immersed in them helps analyzing how things connect and interact.
Visualization of a digital twin in 1:1 scale
For example, in some sectors like automotive, oil & gas or aeronautics, fluid dynamics are of outmost importance. Simulation tools exist to optimize the flow, but actually visualizing it from different angles can help engineering teams to make the trade-off between different constraints. For instance, when designing the side mirror of a car, visualizing in real-time the impact of design modifications on the aerodynamic flow can help find the best balance between style appeal and drag coefficient.
Use cases
- Visualization of fluids, environment and its impact
- Analysis of microscopic elements
- Mix BIM models and point clouds from laser scanning for quality control


